News

Vancouver’s Current Real Estate Market in a Historical Context
November 15, 2016Wading through the vast quantities of information available on the Vancouver real estate market can be confusing as well as daunting. In our opinion, much of that information fails to provide a long-term perspective instead focusing primarily on monthly fluctuations and at best, annual ones. We hope to correct this shortcoming by putting our current market into a broader context…that of the last ten years.

The historical context of the current Vancouver real estate market.
The Historical Pattern
If you’ve been watching any of the recent real estate headlines, you’ll be aware that the Vancouver market is currently rebalancing after a long upward swing. Over the course of the last decade, there have been two other periods where a downward shift in the market occurred. The first, and most significant, was in 2008 (late-spring until early-winter) when we saw a 15% peak to valley correction in prices, and 2012 (early-fall through late-winter) where there was a 5% correction.
What is important to note in each of these past situations is how quickly the market snapped back from weakness. In the case of 2008, the market saw significant weakness from the summer through the winter of that year. Early in 2009 the market returned with a vengeance and by the early fall of that year sales and prices had returned to the peak seen in 2008. The same thing happened in 2012 when prices and sales volume returned to peak levels within three months of the low.
The charts below demonstrate these shifts in the market. We’ve included data for the key years 2008, 2009, 2012, 2013 and 2016 as well as the 10 year averages. These charts are based on REBGV MLS data, but you won’t find these charts anywhere else as we’ve compiled this information just for you.
Sales in the Historical Context
You can see that our current year is mirroring 2008 and 2012 with a slowdown in sales. Note how quickly sales shot back in 2009 and 2013 after the rebalancing that took place in 2008 and 2012. Will early 2017 follow this same pattern?
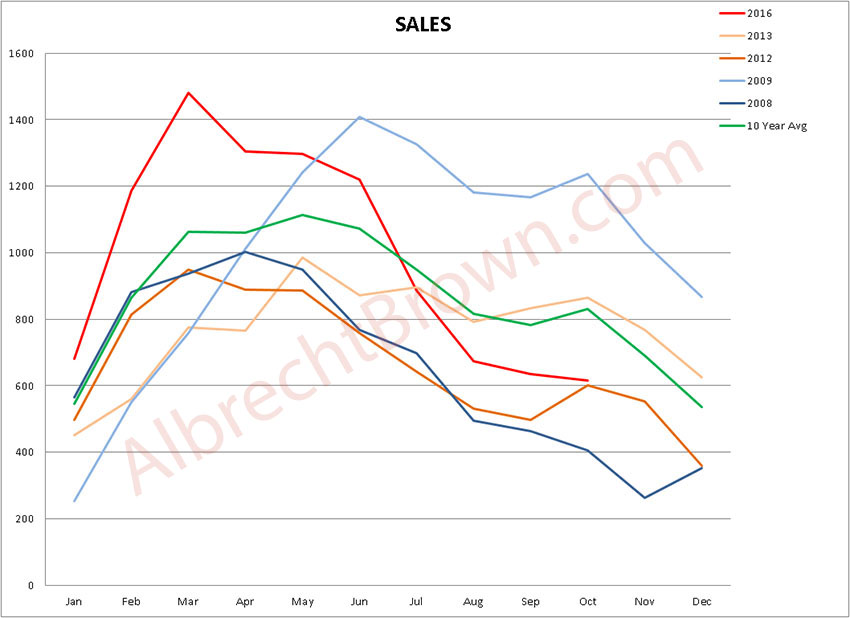
Current market Sales numbers (2016) shown in context of the past ten years of the Vancouver real estate market.
Active Listings Today vs Yesterday
Where today’s market diverges from these past cases is the number of listings on the market. This is a significant difference.
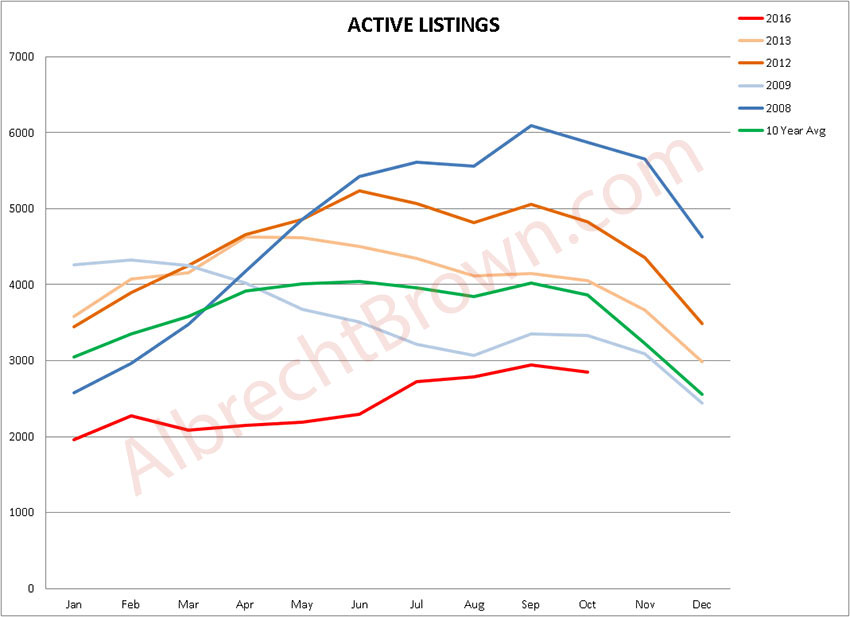
Active Listings in the Vancouver Real Estate Market shown in context of the past ten years.
We are currently at the opposite end of the spectrum when it comes to supply levels (at an historically low level of supply, >25% below the 10 year average). Typically, when the market is slowing down inventory levels build (in 2008 they were 52% higher than the 10 year average and in 2012 25%). The added supply results in a downturn in prices. This is NOT what is currently happening. We are seeing historically low sales numbers, but not the typically concurrent rise in inventory.